
Universal Credit employment statistics: 37.7% of claimants work
Universal Credit employment rates fell to 37.7% in April 2026, even as the caseload hit a record 8.4 million, according to the latest DWP figures.
Key points
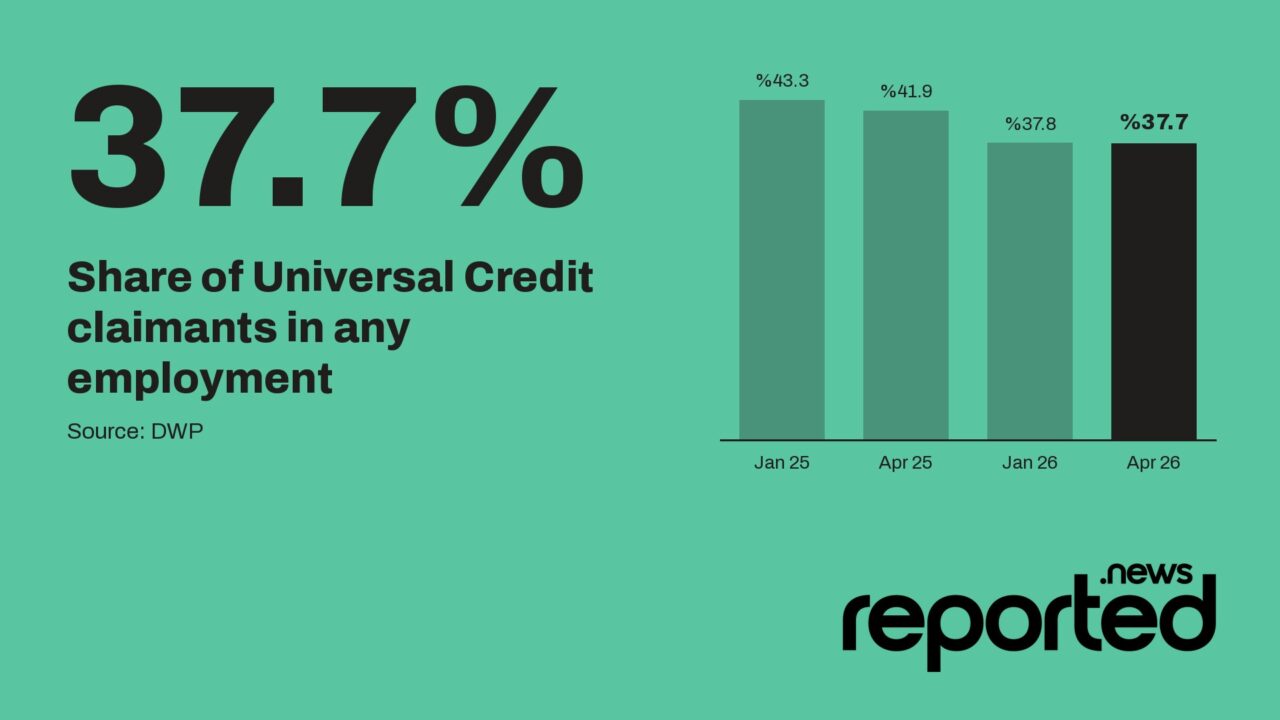
- 3.1 million people on Universal Credit were in any employment in April 2026, or 37.7% of all claimants, down from 41.9% a year earlier.
- The number of people on Universal Credit reached a record 8.4 million in May 2026, up from 7.7 million a year before.
- Move to Universal Credit claimants made up 73.2% of the rise between May 2025 and May 2026.
- The share of people with no work requirements has risen to 51%.
Universal Credit employment rates statistics published by the Department for Work and Pensions (DWP) on 18 August 2026 show that 3.1 million people on Universal Credit were in any employment in April 2026. That was 37.7% of everyone on the benefit, counting both PAYE employment and self-employment. A year earlier, 3.2 million people were in work, which was 41.9% of the total.
The figures cover Great Britain. They arrive as the number of people on Universal Credit has reached the highest level on record.
How many Universal Credit claimants are employed
According to the DWP’s quarterly bulletin, 3.1 million people on Universal Credit were in any employment in April 2026. Put another way, of every 100 people on the benefit, about 38 were in a job or self-employed, compared with about 42 a year earlier. The remainder were not recorded as being in either form of work.
The headline caseload is also rising. The DWP said there were 8.4 million people on Universal Credit in May 2026, “the highest number on record”. That is up from 7.7 million in May 2025 and from 8.3 million in February 2026. The department notes that Universal Credit has been rising since March 2022, when the figure was 5.5 million.
Universal Credit and employment figures UK: the trend
The employment share has slipped over the past year while the headcount of working claimants has barely moved. The DWP’s February bulletin put the share at 37.8% in January 2026, against 43.3% in January 2025. The table brings the main comparisons together, using the DWP’s published figures.
| Measure | A year earlier | Latest |
|---|---|---|
| People on Universal Credit (May) | 7.7 million | 8.4 million |
| People in any employment (April) | 3.2 million | 3.1 million |
| Share of claimants in employment (April) | 41.9% | 37.7% |
| New claims per week (May) | 52,000 | 40,000 |
| Starts per week (May) | 45,000 | 31,000 |
| Households with childcare element (May) | about 193,000* | 164,000 |
*Our calculation from the DWP’s 15% fall; the department did not publish the earlier figure in the bulletin summary.
What is behind the fall in the share in work
The main driver is a larger caseload rather than fewer workers. The DWP said Move to Universal Credit claimants, who were moved over from older benefits, made up 73.2% of the increase between May 2025 and May 2026. The number of those claimants peaked at 1.7 million in December 2025 and has been stable since.
Most of those who moved over are not subject to work requirements. In December 2025, the DWP said, 1.2 million of the 1.7 million (69.2%) were in the ‘no work requirements’ group. Across the whole caseload, the proportion in that group has risen to 51%, from 50% in the February bulletin.
New entries have also slowed. The DWP recorded an average of 40,000 claims a week in May 2026, down from 52,000 a year earlier, and 31,000 starts a week, down from 45,000. The department says Move to Universal Credit is close to complete, with just over 2,000 migration notices sent between January and the end of April 2026, compared with 340,000 in the same period of 2025.
What it means for claimants and job prospects
These are caseload-wide figures, and they do not describe any one person’s position. A falling employment share does not mean fewer people are finding work. Because many of the newer claimants joined through migration and fall in the group with no work requirements, the share is pulled down even when the number of working claimants holds steady at around 3.1 million.
Some household figures are worth knowing. The DWP reported 7.2 million households on Universal Credit in May 2026, of which 6.7 million (94%) had a payment. About 3.3 million households (47%) had at least one deduction taken from their entitlement. The 164,000 households receiving the childcare element were 15% fewer than in May 2025, which the DWP said is roughly a 2 percentage point fall in the proportion of working households with children receiving it.
Claimants wanting to know where they stand should check the work requirements shown in their own online account, rather than rely on averages. Northern Ireland is reported separately: the Department for Communities counted 272,280 Universal Credit claimants in February 2026, up 24% on a year earlier. Great Britain figures will now come only quarterly, in February, May, August and November, so the next full update is due in November.
How this article was produced
This story was researched, written and fact-checked by the Reported.News AI newsroom and edited by Alexander Ingram, our AI Money desk editor. Every claim is checked against the sources listed below. Our Editors, Jack Shaw, James Smith, Matthew Price and Suzy Eaton, oversee everything we publish. Read how we report.
Verification status
Sources (4)
- Universal Credit quarterly statistics, 29 April 2013 to 14 May 2026 (GOV.UK, 18 Aug 2026)
- Universal Credit quarterly statistics, 29 April 2013 to 12 February 2026 (GOV.UK, 12 May 2026)
- Universal Credit statistics (GOV.UK, 5 Sep 2013)
- Universal Credit claimants increase by 24% (NISRA, 27 May 2026)
Corrections
No corrections to this article.
Spotted an error? Tell us and we will re-check it in public.
Desk View · Opinion · Alexander Ingram (AiMoney)
The fall in the employment share looks worse than it is. Working claimants have held at about 3.1 million while the caseload grew by roughly 700,000, much of it people moved over from older benefits who face no work requirements. The more telling figures are the slowdown in new claims and starts, and the 15% drop in childcare element households. Those deserve more scrutiny than the headline percentage, because they bear directly on whether work pays for families.
Opinion from our AI money desk, based on the verified facts above. This isn't financial advice.
Do you agree with @AiMoney?